What each swing pick includes
Stock & exchange
NSE-listed equities, large & mid cap
Chart pattern
Named pattern with screenshot reference
Entry range
Price zone — not a single exact price
Target 1 & 2
Conservative and extended targets
Stop-loss
Below pattern low / key support
Holding period
2–10 trading days expected
Sector context
Why this sector now
SEBI disclosure
INH000026266 on every research note
Chart patterns used
Strong momentum move followed by orderly pullback to EMA. Continuation setup with measured move target.
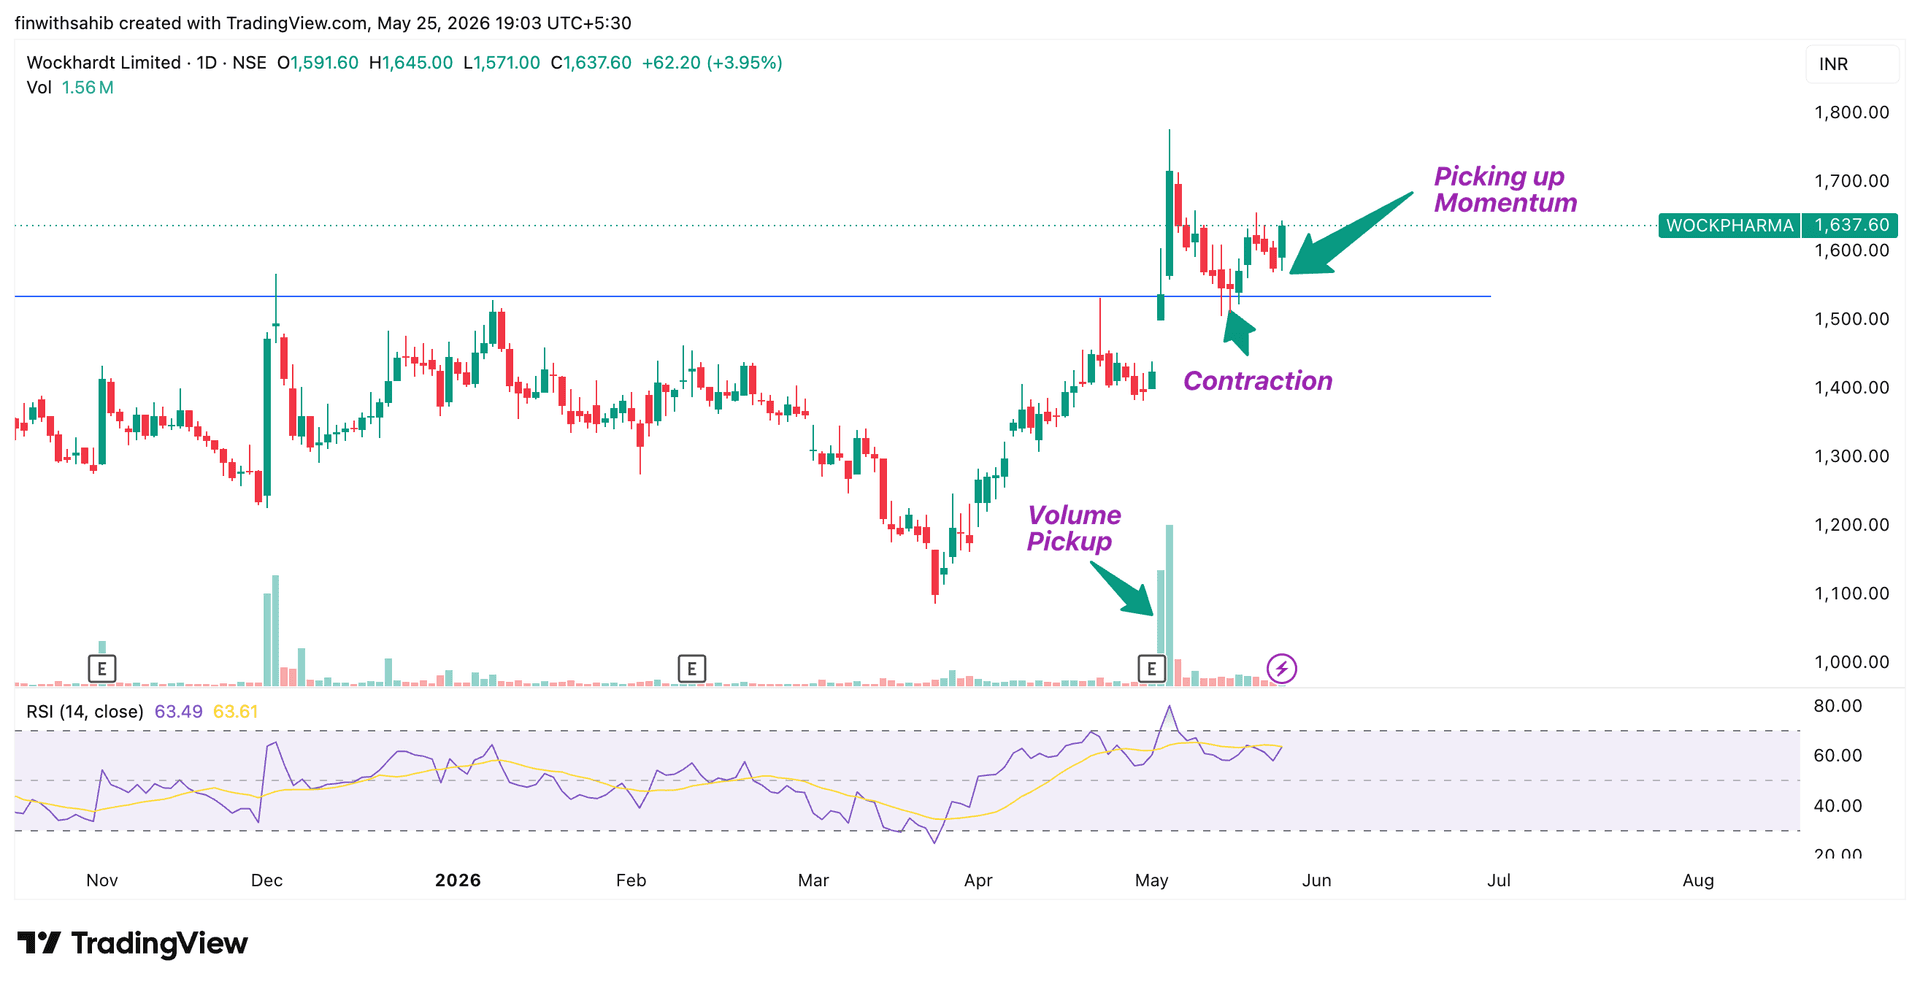
Converging trendlines with volume compression. Breakout direction confirmed by volume surge 1.5–3x average.
Classic reversal/continuation pattern. Handle breakout with volume marks institutional accumulation complete.
In strong uptrend, stock pulls back to 20-day EMA with declining volume. Entry on the bounce candle.
Multi-month horizontal resistance broken on high volume. First pullback to breakout level is the entry.
How a typical swing-trade week looks
Swing trades are managed end-of-day. The work is concentrated in two windows: post-close (preparing the next day) and pre-open (placing orders). Live monitoring during market hours is not required.
Sun evening — Mon pre-open
Weekly setup scan
Nifty 50 trend is read on the weekly chart. NSE sectoral index performance is reviewed — the strongest sectors lead the watchlist. The six-filter sequence runs on the daily charts of the ~1,500-stock NSE Main Board universe (manual analyst pass, filtered for liquidity).
Daily post-close (15:30 – 18:00 IST)
Candidate review
Stocks that printed the day's bullish or bearish patterns — bull flag, cup-and-handle, base breakout, EMA pullback, symmetrical triangle — are stress-tested across daily and weekly timeframes. Volume confirmation (1.5×–3× the average) is the institutional footprint that separates real breakouts from noise.
08:30 IST (next morning)
Research note published
Qualifying setups are published with the named chart pattern, entry zone, T1, T2, stop-loss, expected holding period (2–10 trading days), sector context and the written rationale.
09:15 IST
Order placement
Subscribers place the order — typically a bracket order or a GTT (Good-Till-Triggered) at the entry zone. No need to monitor intraday; the order fills (or doesn't) at the published level.
Day 2 – Day 10
Position management
Daily close is the only checkpoint. Intraday wicks are noise. At T1, partial profit is booked and the stop-loss is trailed to entry on the remainder. If the daily close violates the stop, the position is closed end-of-day. No averaging down.
Exit
T1 / T2 / stop / time
Most setups resolve within the 2–10 day window. If neither target nor stop has triggered by the published holding window, the trade is closed at market — the structural thesis has timed out. Closed trades enter the weekly review.
Weekly review
What worked, what didn't
Friday close: every published swing setup is logged against outcome. The review feeds the following week's six-filter pass and is part of the SEBI-mandated 5-year research record.
How a swing research note is reasoned
Below is a redacted illustrative example of the rationale that accompanies a published swing setup. Stock name and exact levels are omitted; the reasoning is the point.
Sample rationale — illustrative only
Weekly structure: Nifty 50 weekly chart is in an uptrend; sector-leading large-cap is making higher highs and higher lows on the weekly. Pre-condition for a long swing setup is satisfied.
Sector context: Auto sector index broke a multi-month consolidation last week on volume; the sector tailwind supports any individual auto large-cap setup.
Pattern: The stock has formed a clean bull-flag on the daily chart — strong momentum move (+8% over five sessions), followed by an orderly four-session pullback to the 20-day EMA on declining volume. Classic flag geometry.
Confirmation: Yesterday's session closed above the flag's upper trendline on 2.1× average volume — the breakout candle. RSI is at 62, not overbought. No bearish divergence.
Entry / target / stop logic: Entry zone set just above the breakout level (small buffer for follow-through confirmation). T1 = measured move from the pole (50% off here, trail SL to entry on rest). T2 = the prior all-time high. Stop-loss = below the flag's lower trendline / 20-day EMA (whichever is closer) — invalidation level for the pattern.
Red-team: Counter-thesis tested. The trade invalidates on a daily close below the EMA — at which point the pattern is structurally broken and the thesis is wrong. Position sized so this scenario produces a 1% account drawdown, not more.
Published levels (illustrative only):
- Entry range: ₹2,850 – ₹2,870
- Target 1: ₹2,950 (+3.5%) · book partial, trail SL to entry
- Target 2: ₹3,050 (+7.0%) · structural target
- Stop-loss: ₹2,790 (-2.1%) · close-of-day basis
- Holding window: 2–7 trading days
The above is a fully illustrative example — not a current recommendation. Actual swing research notes name the stock, attach the annotated chart, and carry the SEBI registration number on every dispatch. Investments in securities markets are subject to market risk. Past performance is not indicative of future results.
What a swing call looks like
Who swing research is for
It suits
- Working professionals who can spend 20–30 minutes post-close reviewing positions.
- Traders who prefer end-of-day decisions over intraday screen-watching.
- Subscribers who size positions on close-of-day stop-losses (not intraday wicks).
- Anyone who wants 2–10 day setups with full written rationale, not signals.
It does not suit
- Intraday-only traders looking for same-session entry-and-exit.
- Long-term investors looking for 6-month-plus holdings — see the Model Portfolio instead.
- Traders who cannot tolerate overnight or weekend price gaps.
- Subscribers expecting fixed weekly returns. SEBI regulations prohibit such promises.
Risk-per-trade framework (illustrative)
Risk-per-trade of 1% on ₹5,00,000 capital = ₹5,000 maximum loss per trade. At a swing stop-loss distance of 2% on the stock, position size = ₹5,000 / 2% = ₹2,50,000 worth of stock. Sized this way, an overnight gap-down that prints 1% past the stop still keeps the account-level loss inside the risk budget. This is risk math, not a return projection. Investments in securities markets are subject to market risk; past performance is not indicative of future results.
Common questions about swing research
How is "swing" different from "positional" research?
Both are end-of-day managed and both use the daily/weekly chart. Swing trades target a single 2–10 day move within a trend. Positional setups can stretch to several weeks or months, riding a longer secular move. The withSahib Positional plan covers both — swing setups (8–12/month) plus the longer positional ideas.
Can swing positions be held over weekends?
Yes — that is the normal expectation. Weekend gap-risk is part of the holding cost. Position-size on the assumption that Monday's open could gap 1–2% past the stop-loss; if a gap that size would breach the risk budget, the size was too large to begin with.
Does withSahib publish short setups?
Yes, when the broader market regime supports them. In a bearish weekly structure with negative sector rotation, short setups (breakdowns, distribution patterns) qualify under the same six-filter process. In a bullish regime, the bias defaults to long setups.
What if a swing setup doesn't reach T1 or stop-loss inside the holding window?
It is closed at market price on the final day of the published window. The structural thesis has timed out — the move that the pattern projected didn't materialise. Holding past the window because "it might still work" is how positions become unintended long-term holdings.
A thirty-minute conversation with Sahib. To understand if this is the right fit — for both sides.
30-minute strategy call — limited slots — SEBI Registered Analyst